1. Raw-Material Economics: Where the First 30–40% of Cost is Locked
Material selection sets the foundation for total part cost. Yet many OEMs over-specify carbon fiber grade, adding ~15% unnecessary material expense for mechanical properties never utilized in service. We match fiber, resin, and sourcing to actual engineering requirements—not worst-case assumptions.
1.1 Fiber Tow Size & Areal Weight Optimization
Tow count (e.g., 12K vs. 50K) and fabric areal weight (200 g/m² vs. 600 g/m²) dramatically impact both material price and downstream processing:
- 50K tow reduces raw material cost by ~18% per kg versus 12K—but demands wider tape heads and higher compaction pressure during lay-up.
- Heavier fabrics (e.g., 600 g/m²) cut ply count, saving ~8% in lay-up labor, but increase risk of resin over-saturation (+3%) if not controlled.
At JCSPORTLINE, we often specify 300 g/m² 24K hybrid fabrics—balancing stiffness, drapeability, and cost for mid-volume automotive hoods or chassis components. This avoids the “lightweight at any cost” trap that inflates BOM without functional gain.
1.2 Resin System Selection: Epoxy, EP-Phenolic, BMI Trade-offs
Resin choice affects cure speed, fire rating, and tool wear:
- Fast-cure epoxy (5 min @ 120°C) adds 8% to resin cost per liter but halves autoclave time, boosting throughput.
- BMI resins (for >200°C service) cost 3× more and reduce mold life by 50% due to aggressive cure chemistry.
We use a qualification matrix that selects the lowest sufficient Tg for the application—preventing costly over-engineering. For example, a battery enclosure needing only 120°C continuous service doesn’t require BMI.
1.3 Sourcing Strategy: Forward Contracts, Consignment & Vendor-Managed Inventory
Beyond $/kg, cash flow matters:
- 6-month forward contracts can lock in –5% price caps vs. volatile spot markets.
- Consignment inventory reduces WIP capital by 22%, with only a 1% financing fee.
- Our regional hub model enables 3-day call-off with just 0.8% logistics surcharge—ideal for JIT automotive lines.
This gives OEM finance teams real levers to smooth quarterly cash flow while securing supply.
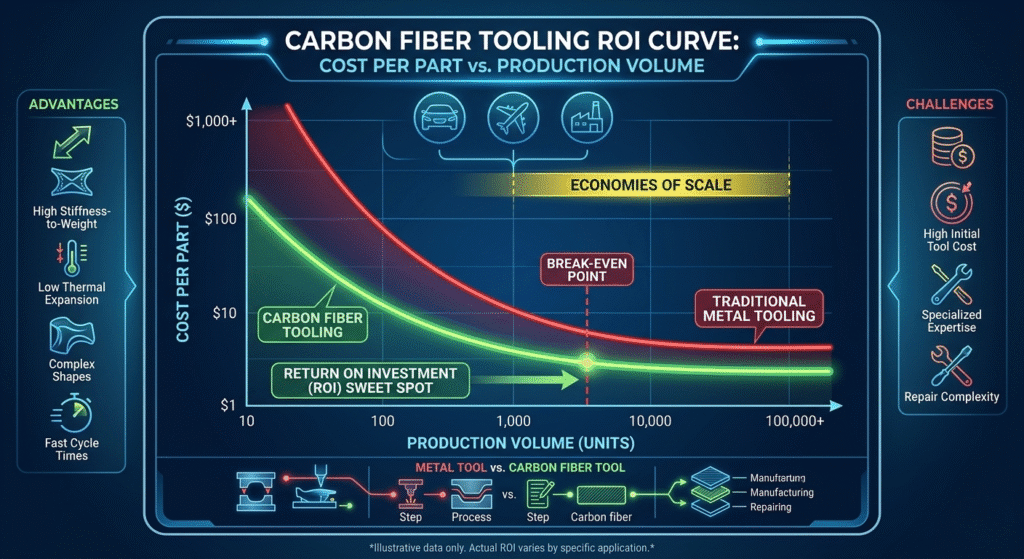
2. Tooling & Capital Amortization: The Hidden 20–25% Driver
Tooling is often treated as a one-time NPI cost—but its depreciation per part is massive at scale. On a 20,000-unit/year hood program, poor tool selection can add $3.20/part in hidden costs.
2.1 Master Model & Plug Economics
The plug (master model) accounts for 15–25% of total tool spend:
- Standard high-temp epoxy plug: $450/m², usable for ~50 pulls.
- Our modular plug system costs 30% more upfront but enables 3× reuse across model-year face-lifts.
- Through our shared plug library, new programs save 12% on initial tooling capex.
This slashes NPI cash burn for minor design iterations—critical in fast-cycle automotive.

2.2 Rapid-Heating Mold Technologies
Slow heat-up = autoclave bottleneck. We deploy:
- Induction-heated shells: ramp at 8°C/s, cutting cycle time by 25% (at +18% mold cost).
- Embedded carbon heaters: 5°C/s ramp, last 40,000 cycles, and save $0.04/part in energy.
In a recent pilot, a 45-minute cycle part saw 14% lower COGS using rapid heating—proving throughput gains outweigh capex premiums at volume.
2.3 Tool Maintenance & Refurbishment Cycles
Unplanned downtime kills margins. Our approach:
- Nickel shell re-coating every 500 pulls: $38/m², doubles mold life.
- DLC (diamond-like carbon) coating: +$22/m², but cuts release agent use by 30% and improves surface finish.
- With our CMMS-driven maintenance schedule, downtime stays at 6% vs. industry average of 12%—avoiding $1.50/part in expedited freight.
3. Labor & Cycle-Time Metrics: Converting Hours into Dollars
Labor isn’t just wage rates—it’s touch-time × complexity × automation. At JCSPORTLINE, we benchmark every operation.
3.1 Ply-by-Ply Lay-Up Time Standards
Our internal time studies show:
- Simple 0.15 m² ply: 18 sec manual vs. 6 sec via ATL.
- Double-curvature 0.5 m² ply: 52 sec manual vs. 14 sec via ATP.
Using our complexity index, we predict labor within ±8% accuracy—helping OEMs validate supplier quotes and avoid hidden padding.
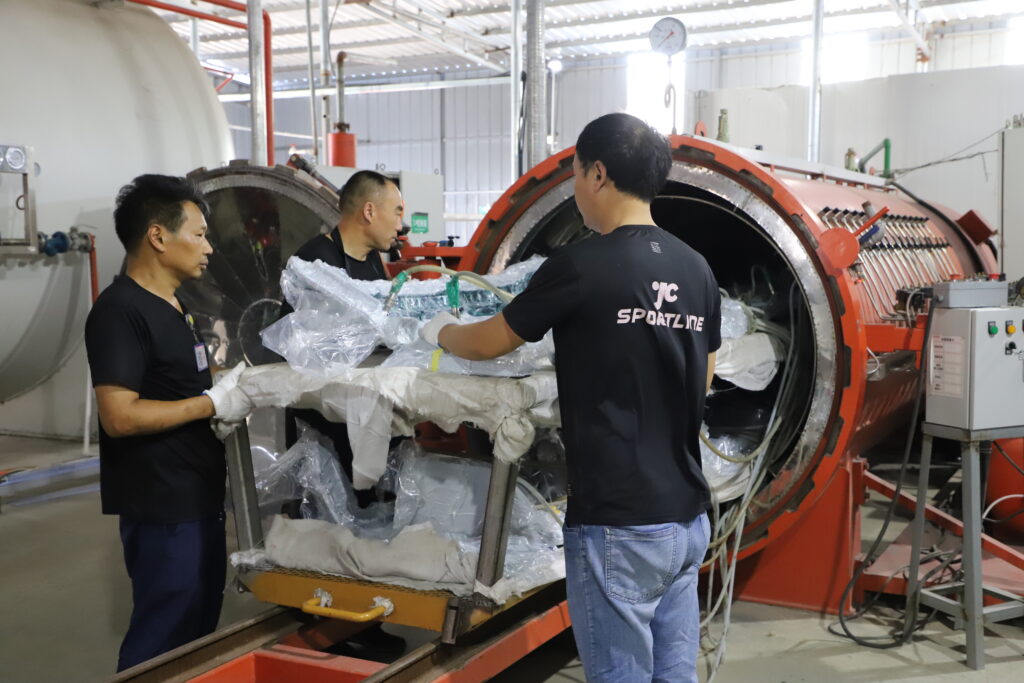
3.2 Cure & Occupancy Cost per Hour
Autoclave time is expensive:
- A 3m-diameter autoclave costs $68/h depreciation + $12/h N₂ + $7/h electricity = $87/h.
- Out-of-autoclave ovens cost $18/h but cure 30% slower, increasing WIP.
Our energy-recuperation system cuts kWh per cure by 11%—making even OOA more economical.
3.3 Non-Destructive Inspection (NDI) Bottlenecks
Inspection queues add 24h WIP and $3/part overhead if inefficient:
- Phased-array UT: 0.8 m²/min, $85/h.
- Thermography: 2 m²/min, but 15% false-call rate.
- Our AI-assisted laser shearography: 3 m²/min, –22% false calls, saving $0.90/part.
Real-time defect feedback prevents batch scrapping.
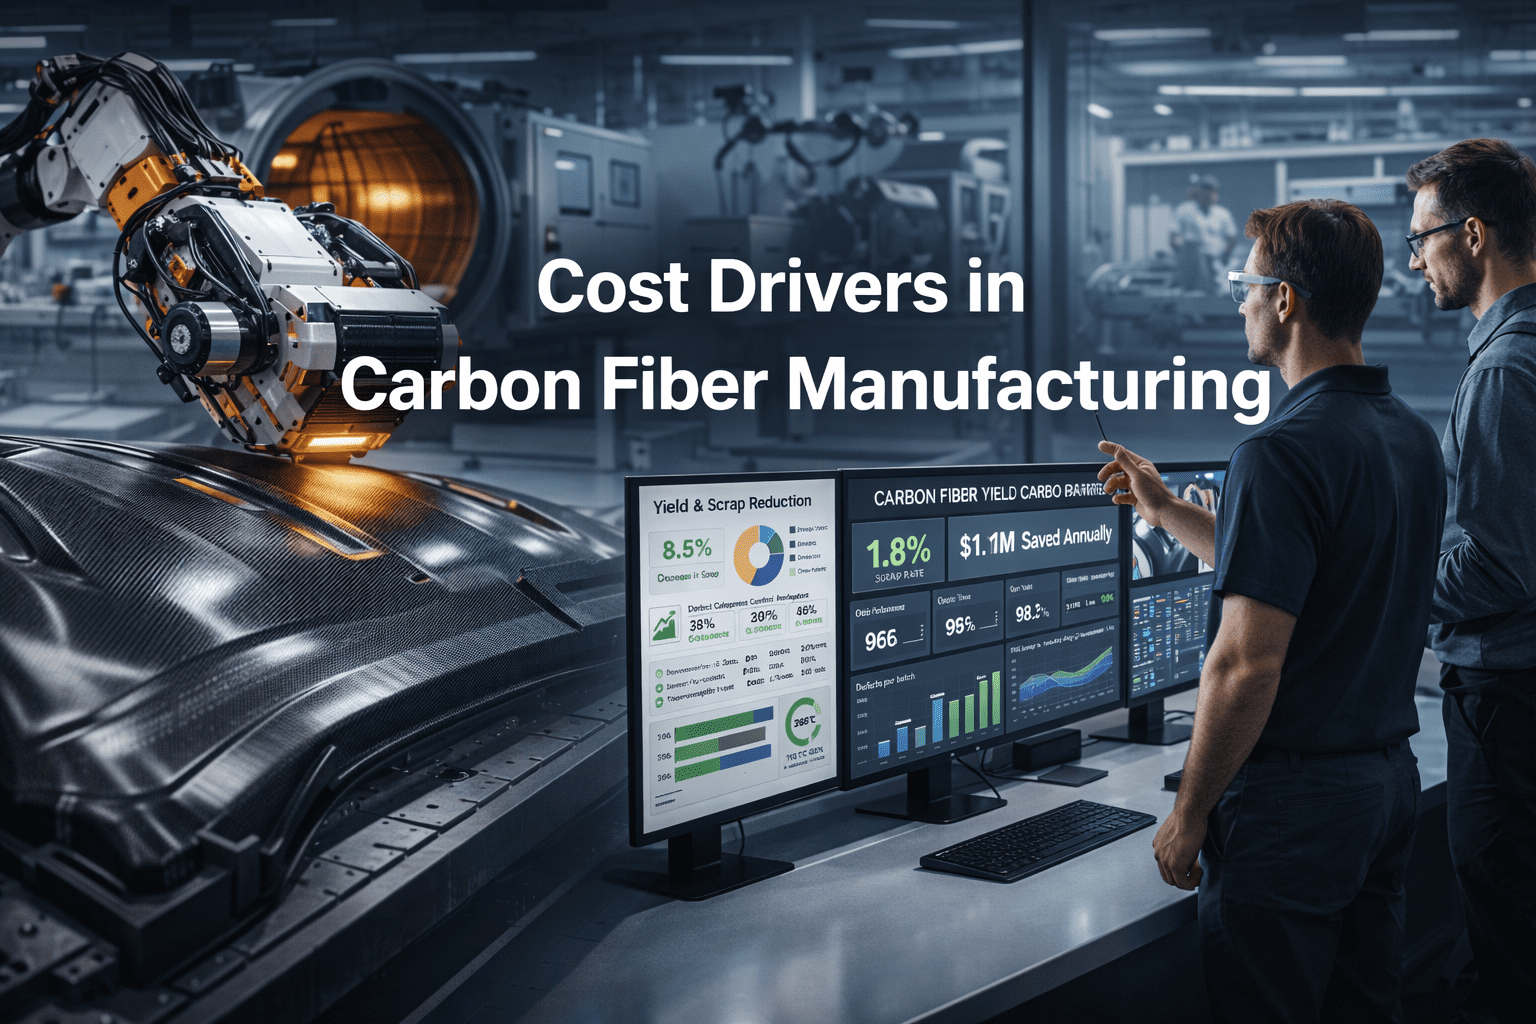
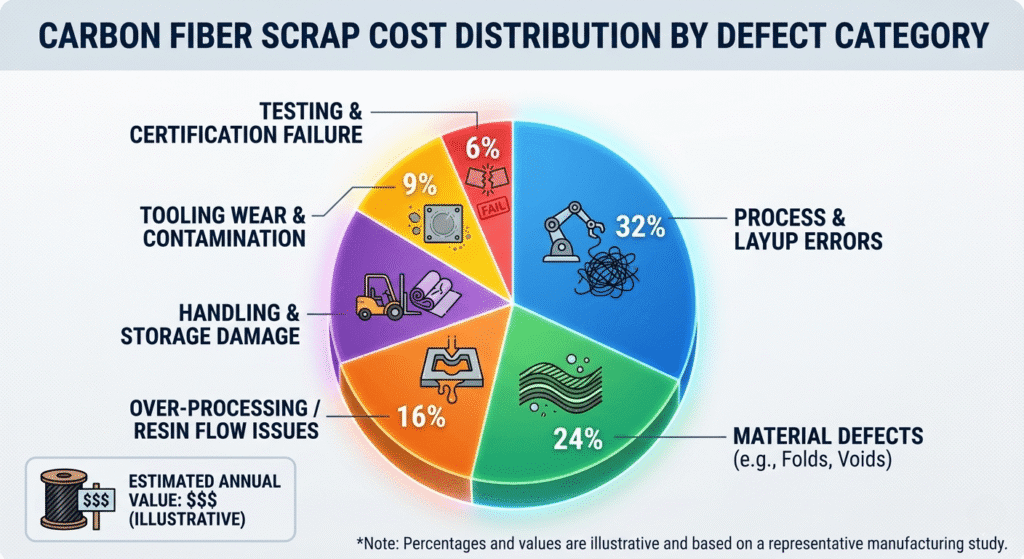
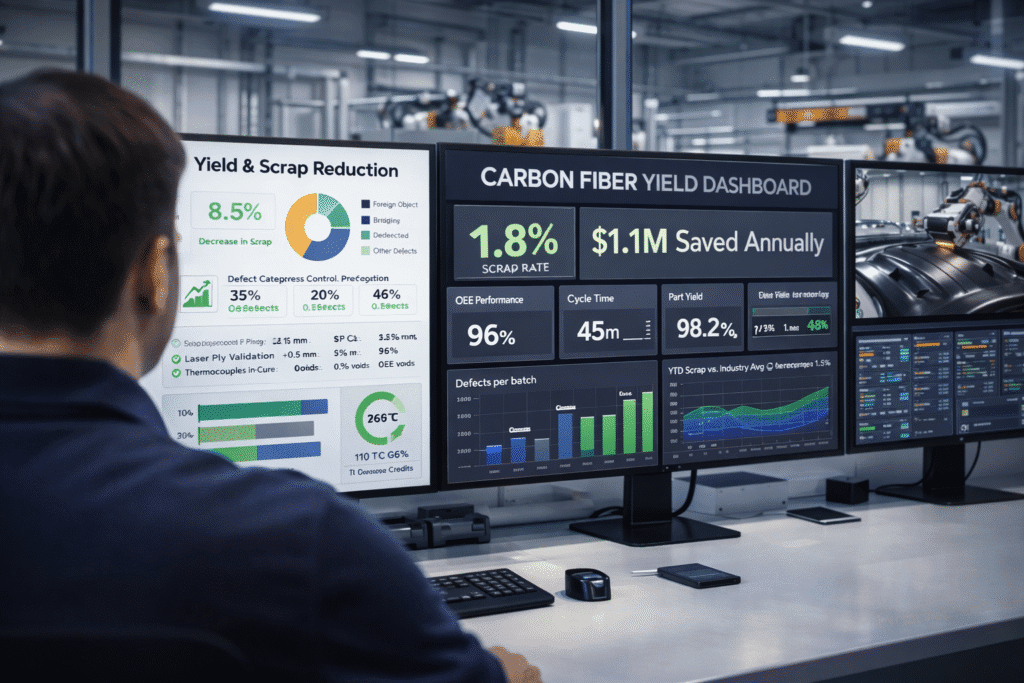
4. Yield & Scrap Economics: Turning Defect Cost into Profit
Industry scrap rates run 4–8%. At JCSPORTLINE, we achieve 1.8%—saving $1.1M annually on a 50-ton program.
4.1 Defect Pareto & Cost per Category
Not all defects cost equally:
- Foreign object at final trim: 100% scrap + 15% sunk labor.
- Bridging detected pre-cure: 40% material salvageable, 25% labor restart.
Our digital ply traceability system links every layer to operator, machine, and batch—reducing defects by 0.9% and enabling root-cause correction.
4.2 Statistical Process Control (SPC) & Real-Time Monitoring
We embed sensors to shrink safety margins:
- Laser ply verification (±0.5 mm) cuts material overuse by 2%.
- In-cure thermocouples + DoE reduce voids from 0.8% → 0.3%, saving 150g resin/part.
OEMs get live OEE and yield dashboards—unprecedented transparency in composites.
4.3 Closed-Loop Recycling & Carbon Credit Recovery
Scrap isn’t waste—it’s revenue:
- EU landfill costs: $1.10/kg vs. pyrolysis disposal at $0.40/kg.
- 30% of milled scrap is sold to electronics as chopped fiber ($1.80/kg).
- In 2023, we converted 18 tons of scrap into 110 tons of CO₂-e credits—supporting OEM ESG goals.
This turns a cost center into a modest profit stream.
FAQ: Quick Answers to Top Cost Questions
Q: What % of carbon fiber part cost is material vs. labor?
A: Typically 30–40% material, 20–25% labor, 20–25% tooling amortization, 5–10% scrap/yield loss.
Q: How much does an autoclave hour cost?
A: $65–$90/hour, including depreciation, nitrogen, and energy.
Q: Does automated lay-up pay off below 5,000 parts/year?
A: Rarely. ROI typically requires >8,000 units/year unless geometry is extremely complex.
Q: How can OEMs audit supplier scrap rates?
A: Demand digital traceability logs, monthly yield reports, and third-party NDI validation.
By dissecting cost drivers across materials, tooling, labor, and yield, JCSPORTLINE delivers carbon fiber parts that are lighter, stronger—and smarter priced. Because in composites, cost isn’t just what you pay—it’s what you prevent.